Before creating my personal website, I wanted to strengthen my understanding of JavaScript, HTML and CSS. This is what led me to create my Fizzbuzz game, using HTML/CSS for styling and JavaScript for my game mechanics. Following fizzbuzz logic, the game generates random numbers between 0 and 100 which are divisible by 3 and or 5. The player must select 'fizz' if the number generated is divisble by 3, 'buzz' if it is divisible by 5, and 'fizzbuzz' if the number is divisible by both. The game will increment the player's score by 10 for each correct answer and store and display their highest score using localStorage. The game features a 30 second timer, which challenges the player to work under a time limit and ensures the game doesn't run indefinitely. To create the design for my game I used Medibang to draw the pixel art for my background and Figma to create my overall layout and create mockups of what each page would look like.
I found this project challenging, as it was my first experience with any of said coding languages, but highly rewarding. Without this experience, I doubt the creation of this website would have gone as smoothly. I gained valuable skills in user-focused, interactive design and surveyed friends throughout the process to ensure the game offered an optimal experience.
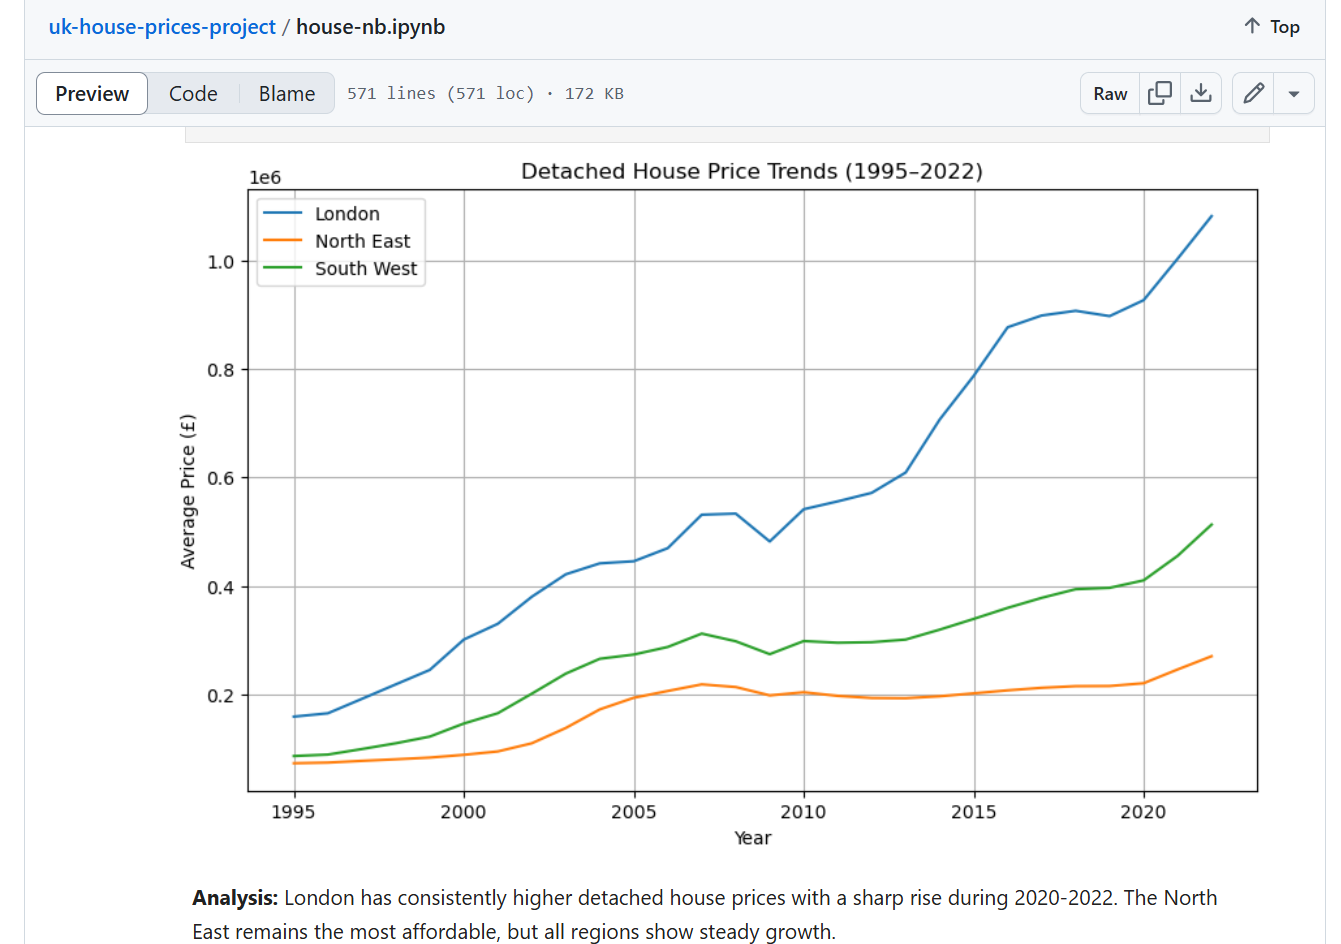
This project was created in a Jupyter Notebook and utilises Python, matplotlib, pandas and seaborn. I used a dataset from the GOV.UK website of house prices in 2022, sorted by region and type. My analysis focused on detached houses across regions and how their prices varied over time. I started off by cleaning the dataset and converting dates to years to create my x-axis. Then, using matplotlib/seaborn, I created a bar, line and scatter chart to visualise said data. I included markdown cells underneath each graph for data analysis. I concluded that London consistently had the highest house prices whilst the North East remained the most affordable. All regions saw a spike in prices in 2020.
I created this project due to my interest in data science. I used the DataCamp bootcamp to enhance my skills in Python and immediately took a liking to libraries such as numpy, pandas and matplotlib. I wanted to create this project to increase my understanding of the field and showcase my use of said libraries.